In a previous post, we worked through importing points from a GPS receiver into Excel and converting them to a format that we can easily plot in ArcMap. The next step is getting those points into ArcMap. Most of the time we can save the spreadsheet as a text file, usually a comma-separated volume (.CSV). However, I’ve run into problems doing that ever since Office 2007 came out. Sometimes it works, sometimes it doesn’t. It boils down to field names and cell formatting. I don’t pretend to understand exactly what 2007 does, because it doesn’t do it to me all the time. (Anyone who knows, feel free to comment or email me and I'll be glad to post your explanation). You can still save as a text file and then edit the field names (which seems to help) but that adds another step to your workflow. In previous versions of Excel, you could also save directly to a database file (.dbf), but it’s not an option in 2007. However, there’s a workaround: Using ArcCatalog to import the spreadsheet data into a table, saved as filename.dbf. This will put it into a .dbf format that ArcMap will play nicely with. By the way, I've included a lot of screenshots with this post, but don't be intimidated: the process is relatively quick once you get the hang of it.
First, continuing from the previous example, let’s save our changes. Now, let’s open ArcCatalog and navigate to the folder where our spreadsheet is saved.
NOTE: For some reason, if you only have the one file in the folder, ArcCatalog doesn’t show it. If you associate the file type [xlsx] in ArcCatalog, it opens with Excel when you double-click it. We don’t want that to happen, so save the file as a 97-2003 Workbook and remove the file association. Now we’re in business!
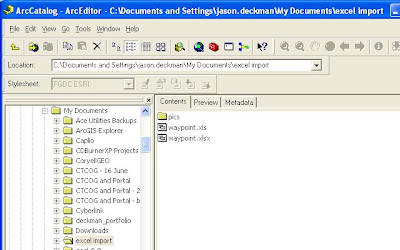
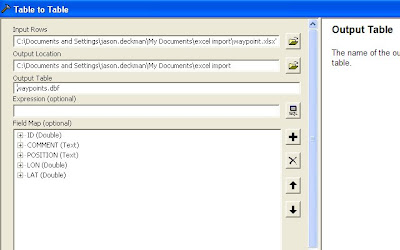
Double-click the file, and choose the sheet containing your data – it should look something like Sheet1$. Right-click this file, and choose Export > To dBase (single)… This opens the “Table to Table” tool dialog box.
Browse to the folder where you want to save this table in the “Output Location” text box. Just highlight the folder where you want to save, and click “Add”. Next, give it a name under “Output Table”. Make sure you give it a name – the Table to Table tool won’t do this for you automatically.
Note that you can also create an SQL expression and pick out certain data from the spreadsheet. This is something I haven’t played with yet, but it could prove useful. For now, we’ll leave it blank. Click OK and your table is created.
Bring it into ArcMap by using the “Add Data” button or simply drag it from ArcCatalog into the Table of Contents in ArcMap.
Click the Source tab at the bottom of the Table of Contents – yep, there it is. But we don’t have points on the map yet! Why not?
We have to tell ArcMap to go find our coordinate information and plot a point for each record in our table. That’s easily done as well. Go to Tools, and choose “Add XY data…”. We do this and a new dialog box opens. If you’ve named your fields LAT and LON, ArcMap will automatically populate them into the correct text box. If not, you can pick them yourself from a drop-down list of fields.
Choose a coordinate system – since these were imported from a GPS receiver, WGS 84 is your best bet.
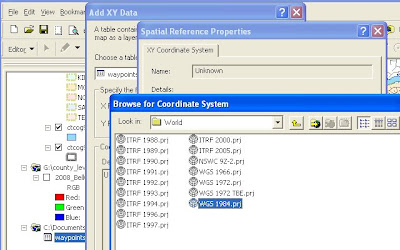
Click OK and you’ll see a new layer – waypoints events.
This only a temporary layer, but you can save it as a shapefile by right-clicking the layer and choosing Data > Export…
Again, this is the hard way to do it. There are a number of utilities that can import GPS data and save it directly to ArcMap. I use the DNRGarmin utility developed by the Minnesota Department of Natural Resources, but you can search the web and find others. However, it’s nice to know what that utility is doing for you so you can do it by hand in a pinch.
To quote my friend Craig Collins over at Temple College, “They pay 747 pilots $100,000 a year to watch the plane fly itself – because they know what to do when the plane STOPS flying itself.”
For government and business professionals in the Central Texas area, including Bell, Coryell, Hamilton, Lampasas, Milam, Mills and San Saba Counties.
Wednesday, December 30, 2009
World Population Data
Nordpil has published a dataset examining and projecting urban populations.
World database of large cities
Be sure to watch the video and play with the Google Earth visualization. Pretty interesting!
Reposted from the GIS Lounge Facebook page
World database of large cities
Be sure to watch the video and play with the Google Earth visualization. Pretty interesting!
Reposted from the GIS Lounge Facebook page
Saturday, December 5, 2009
CTCOG Aerial Photos
Just wanted to provide a quick update of the aerial photos that are currently being captured for the CTCOG area. As of last week, 40% of the 2 foot pixel resolution imagery had been completed. Weather continued to be an impediment to their progress, and their flying time this time of year has been reduced to the hours between 10:00 AM and 2:00 PM due to shadows and wind. Two planes are assigned to our region, so the project should progress quickly between now and the end of December.
Click here to view the status of flights as of Dec 3, 2009 - 11MB image, allow time to download
Once the 2 foot photos are completed for the seven CTCOG counties, they will begin flying the 1 foot photos over the urban corridor between Copperas Cove and Temple. We'll do our best to keep you posted on the progress.
Steve
Subscribe to:
Posts (Atom)