Friday, February 12, 2010

Data request

I'm looking for GPS data for trails in our area.  Specifically in the parks operated by the Corps of Engineers or local state parks.  The data will be used to produce updated maps for a website we recently resurrected:


Send them to my email in .shp or .gpx format. Any tracklogs from Bell, Coryell, Lampasas, Hamilton, Mills and San Saba County are appreciated.

Thanks!

Tuesday, February 9, 2010

Processing Aerial Imagery for use in GIS applications

Steve and Jason from CTCOG drove down to San Antonio last week to visit the firms who are collecting and processing our next set of aerial imagery.

Williams-Stackhouse Incorporated has been providing photogrammetric mapping and related services since 1960, and have produced imagery in our region in the past.  Their staff walked us around their offices, explained every step of the collection process, and patiently answered our questions.  The process from planning to final delivery is more complex than I would have guessed, but the attention to detail is what makes the final product so useful.

First, Williams-Stackhouse sits down with the aviation company to plan a series of flights that will cover the entire area, such that the images overlap.  This information is plotted into the pilot's GPS navigation system.


Once the route is planned, the pilot feeds the shot data, airspeed, and altitude into a custom-built controller that times the shutter release on the camera.  One of the pilots is showing Steve the display that tracks the flight path and allows him to control the camera.

Here's the camera, minus the film cartridge.  The mount is automatically gyro-stabilized in three dimensions, so any small corrections to yaw, pitch and roll don't cause distortion in the image.  For example, if the plane is flying in a crosswind, the pilot will adjust the rudder so that the nose is pointing upwind but the flight path remains straight.  The mount will swivel the camera opposite the direction that the plane is pointing, keeping the film square to the planned flight path.  However, the mount has a limit to how much it can correct, so the pilots only fly in the best possible weather.  


Weather is a consideration not just for a stable flight path, but also for ground visibility.  Clouds between the ground and the camera will obscure the features of the terrain.  High-altitude clouds can cast undesirable shadows beneath the plane. 

Once the flight is complete, the film negative is developed and sent to Williams-Stackhouse for processing. 


Steve is looking at the negative on a light table.  Even at this size, the detail is impressive.

The next step is scanning the film into a digital format.  This scanner automatically scans and advances the roll of film, scanning each frame down to a resolution of 2 microns.  


That means that each pixel in the scanned digital image corresponds to an distance of 0.0000787 (7.87 × 10⁻⁵) inches on the film. 

The images are then adjusted for color, contrast, and brightness on the workstation to the left. 
You can see on the monitor how the image is tiled as the scanner processes each section of the image.


The next step is adjusting for variations in elevation.  The shutter is timed so that there is at least 60% overlap between images, which means we can use stereoscopic glasses to perceive the terrain in thee dimensions (very similar to the glasses you wear at a 3D movie).  Here's one of the technicians showing Steve how he can make adjustments to the images in 3D.


This is the 3D mouse used to process the images so that elevation differences can be calculated.


After several more steps that include controlling color variations, and determining where the edges of the separate images will be cut, another technician will mosaic the tiled images together. Here's a shot of the Temple High School football field being adjusted in Photoshop.


 If there are any smears or distortions that let you see where one image ends and another begins, the problem area is reprocessed and the mosaic is performed again.

Once the mosaic is complete, the image is stored on an external hard drive and shipped to the client.  Based on the number of images, and the resolution and file size, we expect to receive about 2 Terabytes of data when the project is complete.


The aerial acquisition for the entire 7 county region at 2 foot resolution, and the urban corridor between Copperas Cove and Temple at 1 foot resolution, is complete at this time.  They are currently processing the photos, and expect to have their final product delivered to us sometime in June.

Thanks again to Randy Holt, Dave Calkins, and all the staff at Williams-Stackhouse and Krawietz Aerial Photography for an enjoyable and informative visit!

Friday, January 29, 2010

CTCOG Aerial Photos

As of December 31st, approximately 70% of the aerial photos had been captured for the region. Weather has once again held up the progress, but they should be able to continue pretty quickly on the remainder of the project. I’ve attached a map showing their progress.


Click to view larger image.

Wednesday, December 30, 2009

Plotting Points from a Spreadsheet

In a previous post, we worked through importing points from a GPS receiver into Excel and converting them to a format that we can easily plot in ArcMap. The next step is getting those points into ArcMap. Most of the time we can save the spreadsheet as a text file, usually a comma-separated volume (.CSV). However, I’ve run into problems doing that ever since Office 2007 came out. Sometimes it works, sometimes it doesn’t. It boils down to field names and cell formatting. I don’t pretend to understand exactly what 2007 does, because it doesn’t do it to me all the time. (Anyone who knows, feel free to comment or email me and I'll be glad to post your explanation). You can still save as a text file and then edit the field names (which seems to help) but that adds another step to your workflow. In previous versions of Excel, you could also save directly to a database file (.dbf), but it’s not an option in 2007. However, there’s a workaround: Using ArcCatalog to import the spreadsheet data into a table, saved as filename.dbf. This will put it into a .dbf format that ArcMap will play nicely with. By the way, I've included a lot of screenshots with this post, but don't be intimidated: the process is relatively quick once you get the hang of it.

First, continuing from the previous example, let’s save our changes. Now, let’s open ArcCatalog and navigate to the folder where our spreadsheet is saved.

Click for larger image

NOTE: For some reason, if you only have the one file in the folder, ArcCatalog doesn’t show it. If you associate the file type [xlsx] in ArcCatalog, it opens with Excel when you double-click it. We don’t want that to happen, so save the file as a 97-2003 Workbook and remove the file association. Now we’re in business!

Click for larger image

Double-click the file, and choose the sheet containing your data – it should look something like Sheet1$. Right-click this file, and choose Export > To dBase (single)… This opens the “Table to Table” tool dialog box.

Click for larger image

Browse to the folder where you want to save this table in the “Output Location” text box. Just highlight the folder where you want to save, and click “Add”. Next, give it a name under “Output Table”. Make sure you give it a name – the Table to Table tool won’t do this for you automatically.

Click for larger image

Click for larger image

Note that you can also create an SQL expression and pick out certain data from the spreadsheet. This is something I haven’t played with yet, but it could prove useful. For now, we’ll leave it blank. Click OK and your table is created.

Click for larger image

Bring it into ArcMap by using the “Add Data” button or simply drag it from ArcCatalog into the Table of Contents in ArcMap.

Click for larger image

Click the Source tab at the bottom of the Table of Contents – yep, there it is. But we don’t have points on the map yet! Why not?

We have to tell ArcMap to go find our coordinate information and plot a point for each record in our table. That’s easily done as well. Go to Tools, and choose “Add XY data…”. We do this and a new dialog box opens. If you’ve named your fields LAT and LON, ArcMap will automatically populate them into the correct text box. If not, you can pick them yourself from a drop-down list of fields.

Click for larger image

Choose a coordinate system – since these were imported from a GPS receiver, WGS 84 is your best bet.

Click for larger image

Click OK and you’ll see a new layer – waypoints events.

Click for larger image

This only a temporary layer, but you can save it as a shapefile by right-clicking the layer and choosing Data > Export…

Click for larger image

Again, this is the hard way to do it. There are a number of utilities that can import GPS data and save it directly to ArcMap. I use the DNRGarmin utility developed by the Minnesota Department of Natural Resources, but you can search the web and find others. However, it’s nice to know what that utility is doing for you so you can do it by hand in a pinch.

To quote my friend Craig Collins over at Temple College, “They pay 747 pilots $100,000 a year to watch the plane fly itself – because they know what to do when the plane STOPS flying itself.”

World Population Data

Nordpil has published a dataset examining and projecting urban populations.

World database of large cities

Be sure to watch the video and play with the Google Earth visualization. Pretty interesting!

Reposted from the GIS Lounge Facebook page

Saturday, December 5, 2009

CTCOG Aerial Photos

Just wanted to provide a quick update of the aerial photos that are currently being captured for the CTCOG area. As of last week, 40% of the 2 foot pixel resolution imagery had been completed. Weather continued to be an impediment to their progress, and their flying time this time of year has been reduced to the hours between 10:00 AM and 2:00 PM due to shadows and wind. Two planes are assigned to our region, so the project should progress quickly between now and the end of December.

Click here to view the status of flights as of Dec 3, 2009 - 11MB image, allow time to download

Once the 2 foot photos are completed for the seven CTCOG counties, they will begin flying the 1 foot photos over the urban corridor between Copperas Cove and Temple. We'll do our best to keep you posted on the progress.

Steve

Wednesday, November 25, 2009

Parsing data in Excel

At the November meeting, some of our members expressed interest in training - whether by hiring an ESRI instructor or by tapping the wisdom of our members. I'm not the wisest, but I'll get the ball rolling.

In this post I'll talk about parsing data and importing waypoints from a GPS receiver - the easy way and the hard way.

A properly constructed database breaks information into tables, which are made up of fields. Ideally, each field consists of one piece of information. For example, say you have a list of names and addresses. It might look like this:

NAMEADDRESS
John Smith23 Maple Street
Dave Jones48 Cedar Circle
Mary White35 Cedar Circle


Straightforward, right? Not so fast. I want to sort my table alphabetically by last name. That's going to be hard to do, because I only have one field for NAME, and it starts with the first name. Second, what if I wanted to pick out only addresses on Cedar Circle? Same problem - I could use wildcards, but a simple SELECT statement where STREET = "Cedar" is much easier.

Breaking down our table so that each field only contains one piece of information would look more like this:

FIRSTNAMELASTNAMEADD_NOSTREET_NAMESTREET_TYPE
JohnSmith23MapleStreet
DaveJones48CedarCircle
MaryWhite35CedarCircle


Great, that's something we can work with. But what do you do if you're handed a dataset that isn't parsed neatly?

I work at the Central Texas Council Of Governments, and I also teach the Introduction to GIS class at Temple College. One of my students borrowed my GPS to capture some data for her final project. We ran into a problem when it was time to transfer the waypoints from my Garmin Colorado 400T into ArcMap. At work I use the DNR Garmin tool developed by the Minnesota Department of Natural Resources. It's very handy, very intuitive, and saves points or tracklogs directly into a shapefile. As you save the file, you can import it directly into an open map document, saving you the hassle of actually clicking the Add Data button and tediously browsing to the file. Easy!
Easy, that is, if it's installed on your computer. What if you don't have it installed, and don't have an internet connection to download it? Well, you get creative. I had my laptop with me, so that meant I had access to the bundled Garmin software, but when you export the waypoints, it saves the location data into one field.


The position field contains several pieces of information. At first glance, you might think there's two things there - Latitude and Longitude. But we have the direction - North or West, we have the degrees, a space, and then the minutes with decimal seconds. Lots of information - but it's manageable, and there's a couple ways to get this into a format we can import into a table that ArcMap will be able to spatially reference.

One way is to use the coordinate converter on the FCC website. That's fine if you only have a small number of records. But do you really want to type 50 or 100 sets of coordinates and copy-paste the results back into a table? Me neither.

Using the functions in Excel, we can select a certain number of characters in a cell and automatically copy them into a new cell. The LEFT function selects a specified number of characters from the left side of the cell and RIGHT picks from (wait for it...) the right side.
Let's identify the bits of data we need to pull out of the position field, and make new columns for each.


Now let's use LEFT to pull the complete latitude component into a new column:


That's a start, but that letter N is redundant - ArcMap reads positive values as North (Latitude) or East (Longitude) automatically. Negative values are automatically treated as South or West. Remember this when you are doing your Longitude conversion later. In order to get rid of the N, we'll use the RIGHT function and select 9 characters - remember to count the space and decimal point - that's data as well!



So we have a number right? Wrong - there's a space in there, which will force the computer to treat that as a string. Again, using LEFT and RIGHT, pull the degrees into one column and the decimal minutes into another. Next, we'll turn the minutes into a decimal that we can add to our degrees. There's 60 minutes in one degree, so dividing by 60 gives us a decimal that represents our minutes and seconds - see column I below.
For column J, which is almost our final value, do a simple addition and add degrees to minutes.

At this point, you've finished all the formulas for one waypoint. Hover your cursor over the lower right hand corner of each cell, so that it turns into a cross, and drag to highlight all of your data. This copies the formulas to all of the cells. But we can't export this yet - the contents of the cells are formulas, not actual data. We can get those results into a permanent form by copying and using the "Paste Special..." function in Excel.
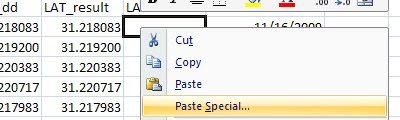

When you click Paste Special, a dialog box opens. Check "Values", make sure "None" is checked under Operation, and click OK. There's your latitude!

Longitude is done much the same way - but be careful of your character count. If you have three digits in your degrees (W101 36.4567) your count will increase. Also, you have one extra step to turn that West value into a negative number.

What if you have a document where the coordinates are in Degrees-Minutes-Seconds? No big deal - you'll have to pull the seconds out using the same LEFT and RIGHT functions, and you'll have an extra step dividing seconds by 60 before you add to your minutes.

Now, save your spreadsheet so you don't lose anything if you screw up the next step. Delete all the calculation columns, making sure to leave the ID, LAT, and LON fields. You can keep your COMMENT and DATE fields, or any other fields you need in the map, but you must have ID and the coordinates to plot these records as points.

In the next post, we'll look at exporting the spreadsheet from Excel 07 into ArcMap.