At the November meeting, some of our members expressed interest in training - whether by hiring an ESRI instructor or by tapping the wisdom of our members. I'm not the wisest, but I'll get the ball rolling.
In this post I'll talk about parsing data and importing waypoints from a GPS receiver - the easy way and the hard way.
A properly constructed database breaks information into tables, which are made up of fields. Ideally, each field consists of one piece of information. For example, say you have a list of names and addresses. It might look like this:
| NAME | ADDRESS |
| John Smith | 23 Maple Street |
| Dave Jones | 48 Cedar Circle |
| Mary White | 35 Cedar Circle |
Straightforward, right? Not so fast. I want to sort my table alphabetically by last name. That's going to be hard to do, because I only have one field for NAME, and it starts with the first name. Second, what if I wanted to pick out only addresses on Cedar Circle? Same problem - I could use wildcards, but a simple SELECT statement where STREET = "Cedar" is much easier.
Breaking down our table so that each field only contains one piece of information would look more like this:
| FIRSTNAME | LASTNAME | ADD_NO | STREET_NAME | STREET_TYPE |
| John | Smith | 23 | Maple | Street |
| Dave | Jones | 48 | Cedar | Circle |
| Mary | White | 35 | Cedar | Circle |
Great, that's something we can work with. But what do you do if you're handed a dataset that isn't parsed neatly?
I work at the Central Texas Council Of Governments, and I also teach the Introduction to GIS class at Temple College. One of my students borrowed my GPS to capture some data for her final project. We ran into a problem when it was time to transfer the waypoints from my Garmin Colorado 400T into ArcMap. At work I use the
DNR Garmin tool developed by the Minnesota Department of Natural Resources. It's very handy, very intuitive, and saves points or tracklogs directly into a shapefile. As you save the file, you can import it directly into an open map document, saving you the hassle of actually clicking the Add Data button and tediously browsing to the file. Easy!
Easy, that is, if it's installed on your computer. What if you don't have it installed, and don't have an internet connection to download it? Well, you get creative. I had my laptop with me, so that meant I had access to the bundled Garmin software, but when you export the waypoints, it saves the location data into one field.
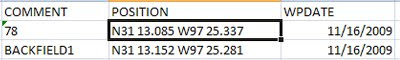
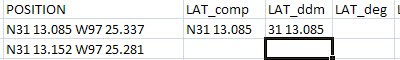
The position field contains several pieces of information. At first glance, you might think there's two things there - Latitude and Longitude. But we have the direction - North or West, we have the degrees, a space, and then the minutes with decimal seconds. Lots of information - but it's manageable, and there's a couple ways to get this into a format we can import into a table that ArcMap will be able to spatially reference.
One way is to use the
coordinate converter on the FCC website. That's fine if you only have a small number of records. But do you really want to type 50 or 100 sets of coordinates and copy-paste the results back into a table? Me neither.
Using the functions in Excel, we can select a certain number of characters in a cell and automatically copy them into a new cell. The LEFT function selects a specified number of characters from the left side of the cell and RIGHT picks from (wait for it...) the right side.
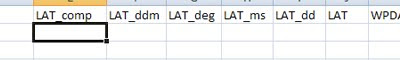
Let's identify the bits of data we need to pull out of the position field, and make new columns for each.
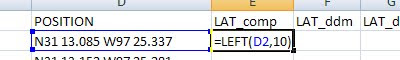
Now let's use LEFT to pull the complete latitude component into a new column:
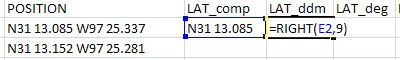
That's a start, but that letter N is redundant - ArcMap reads positive values as North (Latitude) or East (Longitude) automatically. Negative values are automatically treated as South or West.
Remember this when you are doing your Longitude conversion later. In order to get rid of the N, we'll use the RIGHT function and select 9 characters - remember to count the space and decimal point - that's data as well!
So we have a number right? Wrong - there's a space in there, which will force the computer to treat that as a string. Again, using LEFT and RIGHT, pull the degrees into one column and the decimal minutes into another. Next, we'll turn the minutes into a decimal that we can add to our degrees. There's 60 minutes in one degree, so dividing by 60 gives us a decimal that represents our minutes and seconds - see column I below.
For column J, which is almost our final value, do a simple addition and add degrees to minutes.
At this point, you've finished all the formulas for one waypoint. Hover your cursor over the lower right hand corner of each cell, so that it turns into a cross, and drag to highlight all of your data. This copies the formulas to all of the cells. But we can't export this yet - the contents of the cells are formulas, not actual data. We can get those results into a permanent form by copying and using the "Paste Special..." function in Excel.
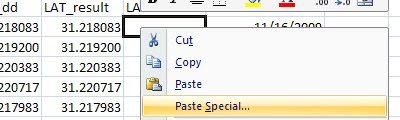
When you click Paste Special, a dialog box opens. Check "Values", make sure "None" is checked under Operation, and click OK. There's your latitude!
Longitude is done much the same way - but be careful of your character count. If you have three digits in your degrees (W101 36.4567) your count will increase. Also, you have one extra step to turn that West value into a negative number.
What if you have a document where the coordinates are in Degrees-Minutes-Seconds? No big deal - you'll have to pull the seconds out using the same LEFT and RIGHT functions, and you'll have an extra step dividing seconds by 60 before you add to your minutes.
Now, save your spreadsheet so you don't lose anything if you screw up the next step. Delete all the calculation columns, making sure to leave the ID, LAT, and LON fields. You can keep your COMMENT and DATE fields, or any other fields you need in the map, but you must have ID and the coordinates to plot these records as points.
In the next post, we'll look at exporting the spreadsheet from Excel 07 into ArcMap.


